Fun facts August 2, 2019

An interesting stat which can give some insight to the national market is the Home-ownership Rate.

It simply looks at the percentage of Americans who own their home instead of rent.

The most recent report from the Census Bureau shows the rate at 64.2%.

Most importantly, this number is showing stability after many years of change.

After many years of hovering around 64%, the Home-ownership Rate started increasing in 1996 and reached as high as 69.5% in 2005.

2008 started several years of declining back to the pre-1996 levels of 64%.

So today it’s back to what seems to be “normal” based the long-term average.

BlogFun facts May 31, 2019

New Home News!


Nationally, sales of new homes are stronger than they have been in a long time. March was the best month since 2007 and April was the third-best month in that same time period.


This research comes from the National Association of Home Builders who show that we are on pace to sell 673,000 new homes this year across the Country.  5 years ago there were roughly 450,000 sales of new homes.


For the first four months of 2019, new home sales are 6.7% ahead of the sales pace of the initial four months of 2018.


What is interesting is that those gains have distinct regional clustering. Year-to-date sales are up 10.3% in the South, 6.7% in the West (concentrated in the Mountain states), and 1.3% in the Midwest, while recording a 17.6% decline in the Northeast.

Fun facts May 24, 2019

The Question of the Day

As we are helping people understand their new property assessments and putting together information so that they may protest their new valuation, here is the most common question we hear…

Did my property really go up that much?

Here are some stats that will help you answer that question.

First, you need to know that property assessments are done by the County every two years. So, as you look at how much your property increased in value according to the County, keep in mind that this increase is over a two-year period.


Next, it will help you to know how much our markets increased, on average, over the last two years. This data comes from our most trusted source, the Federal Housing Finance Authority.

Two Year Appreciation:

• Metro Denver = 18.65%
• Larimer County = 17.60%
• Weld County = 22.31%
• Boulder County = 16.28%


If you have questions about your new valuation or how to protest your property’s assessment, we would be happy to help. Just reach out and let us know.

Fun facts March 18, 2019

Vegas Baby!


The results are in from FHFA.gov’s latest ranking of the top performing markets in the U.S.

Each quarter they track 245 cities across the country and rank their real estate markets by home price appreciation.


What’s the highest performing city the the U.S.

Vegas!  Their prices have gone up 17.63% in the last year.


How about the worst?

Bloomington, Illinois sits in dead last where prices went down 3.58%


Here’s how Colorado cities are ranked:

• #10 Colo. Springs = 11.41%
• #16 Greeley = 10.68%
• #59 Fort Collins = 8.29%
• #64 Denver = 8.15%
• #97 Boulder = 6.85%

Posted on March 1, 2019 at 9:52 am
Fort Collins | Category: BlogFun Facts | Tagged 
Fun factsWindermere March 1, 2019

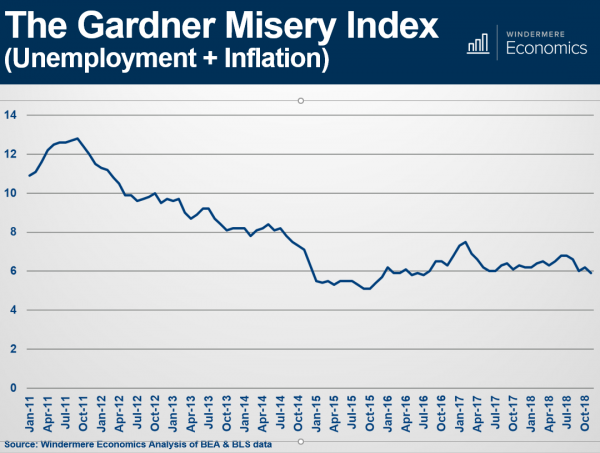
Misery Index


Last week at our Market Forecast events, Chief Economist Matthew Gardner shared, among many stats, his famous “Misery Index.”

A valuable statistic with a funny title.

The Misery Index simply measures inflation plus unemployment.

It’s an effective way to look at our Nation’s economy.

Today’s Index sits just below 6%. Back in October 2011, it was close to 13%.

The lowest it has been in the last 7 years is October 2015 when it was near 5%.

________________________________________

If you would like a copy of the entire Forecast presentation, go ahead and reach out to us.

We would be happy to put it in your hands.

BuyersFun facts February 20, 2019

The Whole Story

Metro Denver has 2.1 months of inventory on the market. This means that, at the current pace of sales, it would take just over 2 months to sell every single-family home currently listed for sale.

But that’s not the whole story because inventory levels vary drastically depending upon the price of the home.

When we take a closer look at months of inventory broken down by price range this is what we see:

• Under $400,000 = 0.9 months
• $400,000 to $500,000 = 1.8 months
• $500,000 to $750,000 = 3.1 months
• $750,000 to $1,000,000 = 4.2 months
• Over $1,000,000 = 7.7 months

These numbers represent great news for move-up buyers because they can sell in a strong market and potentially move up to a market that is market that is not as strong.


Below is a short video with a recap of our annual Market Forecast presentation!

BuyersFirst Time Home BuyerFun facts December 11, 2018

Good Loan News

Here are two recently-announced pieces of really good news for home buyers.

• The Colorado Housing and Finance Authority recently raised the income limit for their down payment assistance program to $115,600.

Now more people can get help with a down payment.

• Fannie Mae and Freddie Mac raised their conforming loan limits so that more people can use a conforming loan and not be forced to use a ‘jumbo’ loan.

Contact us if you would like to hear how these pieces of news could help you.

BuyersFun facts November 30, 2018

HQ3?

The Front Range may have lost out on Amazon’s HQ2, but that doesn’t mean their company won’t affect our economy.

Denver was in the running for Amazon’s massive new second headquarters that supposedly would bring 50,000 new high-paying jobs and $5 Billion of investment.

In the end Amazon chose to split the headquarters among two East-Coast cities and many in Colorado breathed a sigh of relief.

But they are will continue to be an economic force in our state.

Over the past two years, Amazon has greatly expanded its footprint in Metro Denver, opening up a sorting center in Aurora, fulfillment centers in Aurora and Thornton, a Prime Now center in Denver and a new delivery center in Centennial.

They will soon have 3,000 workers here and that number is expected to grow significantly.

Fun facts November 26, 2018

How We Rank

Here’s how the largest Colorado cities rank on the most recent Federal Housing Finance Authority’s quarterly report.  They study the appreciation rate in 245 metropolitan areas all over the country.

City                        Rank                Appreciation

Boulder                        65th                   8.76%

Colorado Springs      15th                    11.54%

Denver                        30th                    10.16%

Fort Collins                85th                    7.51%

Grand Junction         58th                   9.01%

Greeley                        45th                    9.51%

For Buyers & Sellers November 22, 2018

How Neighborhood Affects Home Value

Whether you’re buying or selling, accurately pricing a home requires professional assistance from someone who knows the neighborhood.

The “estimated” home prices you see posted online can be off by tens of thousands of dollars – not because they’re dishonest, but because the computer programs generating these guesstimates don’t take into account the current condition of a house, the amenities that are included, the qualities of the surrounding neighborhood, and so much more.

A real estate agent’s appraisal will not only consider the selling prices of surrounding properties, as the online services do, but also take into consideration a host of other criteria. For instance, when it comes to assessing the surrounding neighborhood, the following factors can often significantly affect the market price of a home:

School quality

The quality of neighborhood schools has a dramatic impact on home price, whether buyers have school-age children or not. In the most recent study on the subject, researchers from the Federal Reserve Bank of St. Louis found that above-average public schools (those with math scores 4.6 percent better than the average) increased the value of nearby homes by 11 percent (or an average of $16,000) in the St. Louis area.

A park within walking distance

Parks are so important to families today that simply having one within a quarter mile can increase the value of a house by 10 percent, according to a new study from the University of Pennsylvania’s Wharton School.

Stores nearby

The impact that retail areas have on home values depends on the type of community. According to a study recently released by the Massachusetts Institute of Technology, homes in urban areas sell for six percent to eight percent more than average if they’re within a quarter mile of a retail cluster (shops and restaurants). However, in suburban communities, it’s the homes that are a mile from any retail centers that sell for the most (homes located closer than that actually sell for 8 percent less than average).

Freeway access

Because we’re a car-oriented society, most people are willing to pay more to live within a couple miles of an on-ramp to a major highway or freeway, which saves gas and speeds commute times. However, if the home is located too close (within a half mile of the freeway), the associated noise and air pollution can push the price in the opposite direction.

Vacant lots in the vicinity

Being surrounded by vacant land can be a good thing in rural areas, but it’s usually a negative for urban homeowners. A recent Wharton School study found that higher concentrations of unmanaged vacant lots in an urban neighborhood drag down the values for surrounding homes by an average of 18 percent.

Proximity to nuisances and environmental hazards

Two recent studies (one from an Arizona assessor’s office, the other by the University of California Berkeley) show that homes located near a landfill or power plant usually sell for four to 10 percent less than more distant homes. The same can usually be said for homes located too close to manufacturing facilities – especially those that make lots of noise or produces noxious odors.

Neighborhood foreclosures

According to a recent study by the Massachusetts Institute of Technology, the value of a home decreases by one percent for every foreclosed home within 250 feet of it. Why? The lower sales prices of foreclosed homes can quickly drag down the neighborhood’s comparable prices. Plus, the owners of these properties usually don’t have the money or interest in maintaining them after they go into foreclosure, which can create an eyesore for all the other homes in the vicinity.

Percentage of homeowners

Are there more owners than renters living in the neighborhood? If so, property values are usually better than average. Homeowners tend to take better care of their property than renters or landlords, which improves the curb-appeal for the whole community.

Public services

Some communities have a wealth of quality public services available to them – including regular street cleanings, scheduled street repair, graffiti removal services, landscape maintenance, neighborhood beautification efforts, and more. Needless to say, homes lucky enough to be located in those areas typically command higher property valuations.

Home sellers can use these factors to justify a higher asking price. Buyers can use them to try and negotiate something lower. However, when it comes to attaching specific dollar amounts, that is something best left to your real estate agent, an objective professional with a deep understanding of the local market.

If you are looking for an experienced real estate agent, connect with us here.